Physical Address
304 North Cardinal St.
Dorchester Center, MA 02124
Physical Address
304 North Cardinal St.
Dorchester Center, MA 02124

In this technical blog, we will look at the past performance of the 4-hour Elliott Wave Charts of Tesla ticker symbol: TSLA. We presented to members at the elliottwave-forecast. In which, the rally from 22 April 2024 low ended in an impulse structure. But showing a higher high sequence within the cycle from January 2023 low supports more upside. Therefore, we advised members not to sell the stock & buy the dips in 3, 7, or 11 swings at the blue box areas. We will explain the structure & forecast below:
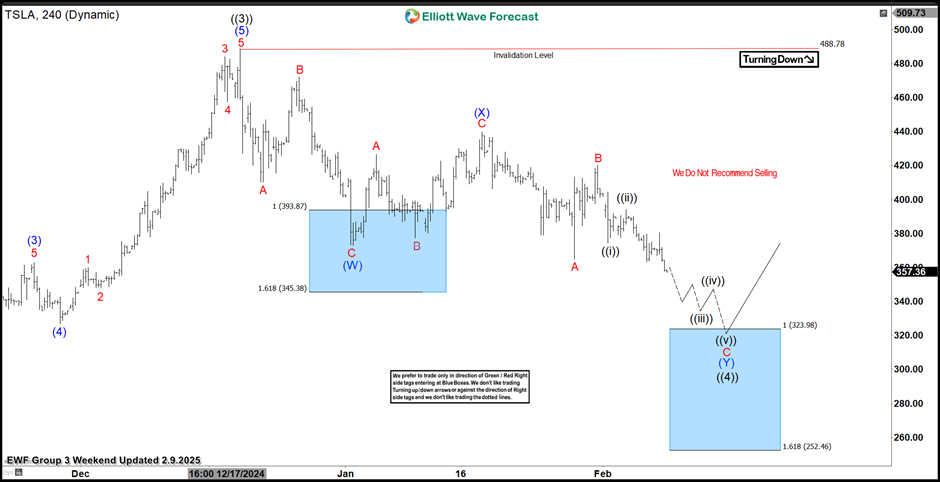
Here’s the 4-hour Elliott wave chart from the 2.09.2025 weekend update. In which, the cycle from the 4.22.2024 low ended in wave ((3)) at $488.54 high. Down from there, the stock made a pullback in wave ((4)) to correct that cycle. The internals of that pullback unfolded as Elliott wave double three structure where wave (W) ended at $373.04 low. Wave (X) bounce ended at $439.74 high and wave (Y) managed to reach the blue box area at $323.98- $252.46. From there, buyers were expected to appear looking for the next leg higher or for a 3 wave bounce minimum.
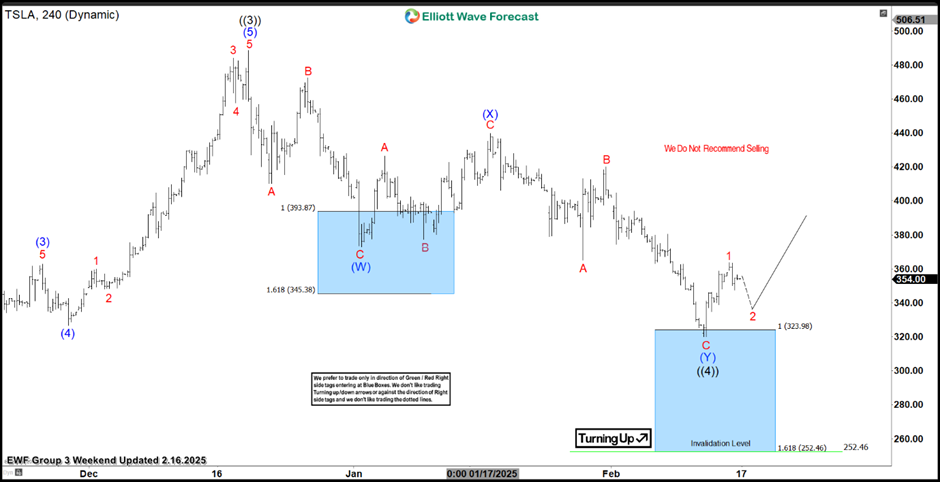
This is the latest 4-hour Elliott wave Chart from the 2.16.2025 weekend update. In which the stock is showing a reaction higher taking place, right after ending the double correction within the blue box area. However the bounce needs to react higher minimum towards $380.19 level to allow longs to get into a risk-free position. Later on, it would need to see a break above $488.54 high to confirm the next extension higher & avoid deeper pullback.