Physical Address
304 North Cardinal St.
Dorchester Center, MA 02124
Physical Address
304 North Cardinal St.
Dorchester Center, MA 02124

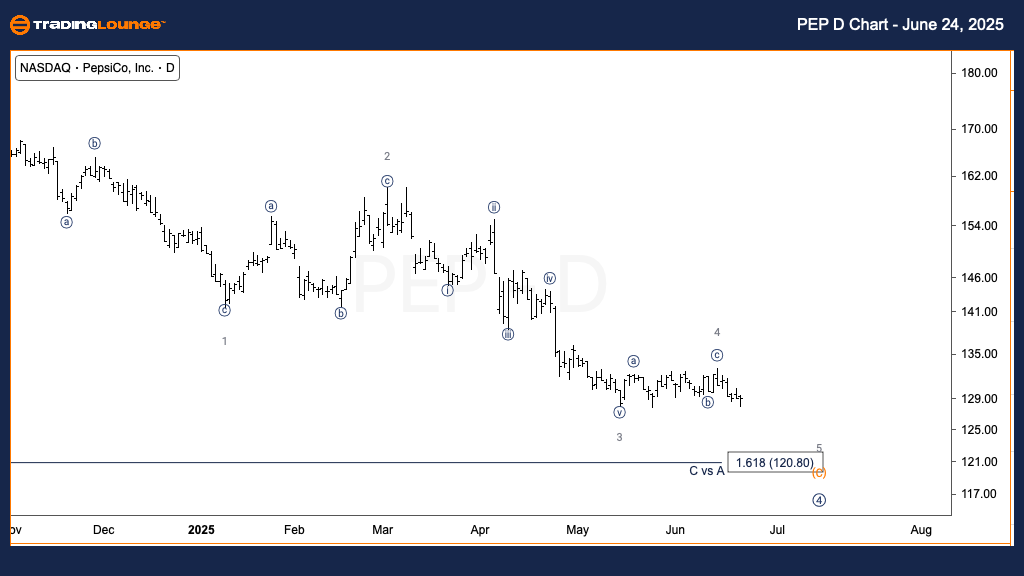
Function: Trend.
Mode: Impulsive.
Structure: Motive.
Position: Wave (C) of 4.
Direction: Downside in Wave (C).
Details:
We anticipate continued downside movement in Wave (C), targeting the $100 level. The current price action is aligning well with the downward trajectory.
The daily Elliott Wave analysis for Pepsico Inc. (PEP) shows an ongoing corrective phase within Intermediate Wave 4, unfolding as a zigzag (A)-(B)-(C). Currently, Wave (C) is active and showing an impulsive structure. This suggests further bearish movement, with the target around $100, consistent with the continuation of the correction phase.
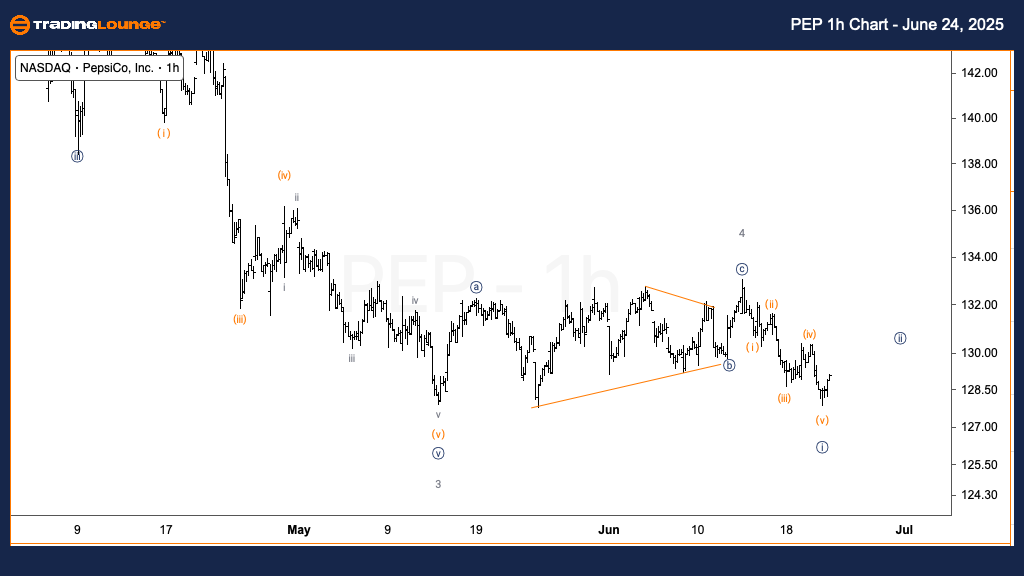
Function: Trend.
Mode: Impulsive.
Structure: Motive.
Position: Wave {i} of 5.
Direction: Downside within Wave 5.
Details:
Wave {i} of 5 appears completed. A three-wave pullback in Wave {ii} is expected before the downtrend continues with Wave {iii}.
The 1-hour chart analysis of PEP supports a bearish continuation. The initial five-wave sequence forming Wave {i} of 5 has likely completed. A corrective retracement in Wave {ii} is anticipated next. This will likely lead into Wave {iii}, resuming the downward move within the broader Wave (C) structure, reinforcing the intermediate-term bearish outlook.