Physical Address
304 North Cardinal St.
Dorchester Center, MA 02124
Physical Address
304 North Cardinal St.
Dorchester Center, MA 02124

The Japanese Yen (JPY) selling remains unabated through the early European session on Monday as traders continue to push back their expectations about the likely timing of the next interest rate hike by the Bank of Japan (BoJ) to Q1 2026. Adding to this worries about the potential economic fallout from existing 25% US tariffs on Japanese vehicles and 24% reciprocal levies on other imports undermines the JPY. This, along with a modest US Dollar (USD) strength, lifts the USD/JPY pair to a fresh high since May 14, closer to mid-147.00s in the last hour.
The JPY bulls, meanwhile, seem to have digested Friday’s release of Japan’s annual National Consumer Price Index (CPI), which remained well above the BoJ’s 2% target in May. Moreover, the better-than-expected PMI prints from Japan give the BoJ more impetus to hike interest rates again in the coming months. This, however, does little to provide any respite to the JPY bulls. Even rising geopolitical tensions in the Middle East fail to benefit the JPY’s relative safe-haven status, suggesting that the path of least resistance for the USD/JPY pair is to the upside.
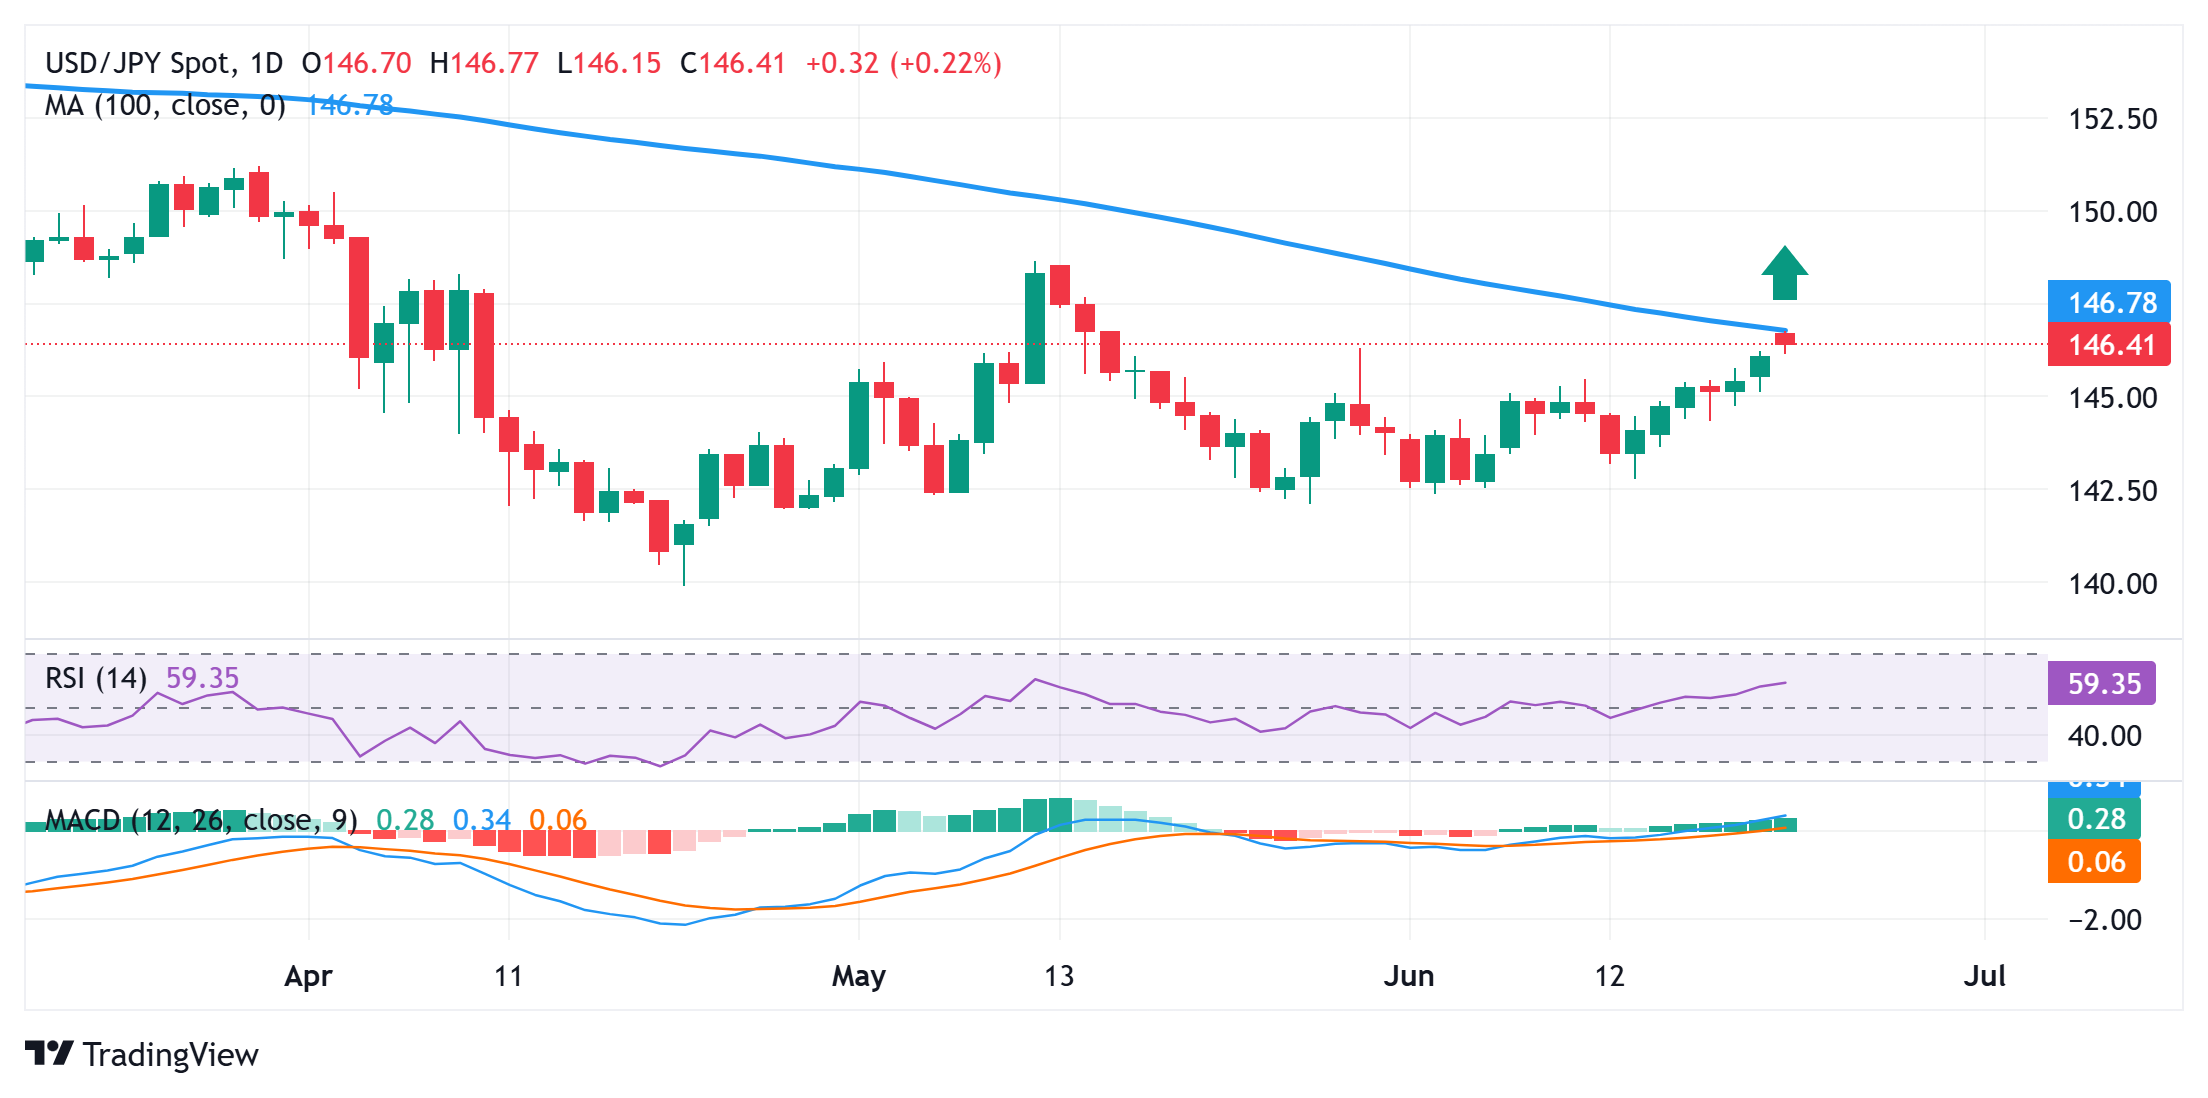
From a technical perspective, the USD/JPY pair needs to make it through the 100-day Simple Moving Average (SMA) barrier around the 146.80 region for bulls to retain short-term control. Some follow-through buying beyond the 147.00 mark will confirm a positive outlook and lift spot prices to the 147.40-147.45 intermediate hurdle en route to the 148.00 round figure and 148.65 region, or the May monthly swing high.
On the flip side, any corrective pullback below the 146.00 mark is more likely to attract fresh buyers and find decent support near the 145.30-145.25 area. This, in turn, should help limit the downside for the USD/JPY pair near the 145.00 psychological mark. The latter should act as a strong base for spot prices, which if broken decisively might prompt some technical selling and shift the near-term bias in favor of bearish traders.
The table below shows the percentage change of Japanese Yen (JPY) against listed major currencies today. Japanese Yen was the strongest against the New Zealand Dollar.
| USD | EUR | GBP | JPY | CAD | AUD | NZD | CHF | |
|---|---|---|---|---|---|---|---|---|
| USD | -0.41% | -0.24% | 0.35% | 0.06% | 0.21% | 0.37% | -0.01% | |
| EUR | 0.41% | 0.15% | 0.80% | 0.48% | 0.59% | 0.79% | 0.37% | |
| GBP | 0.24% | -0.15% | 0.69% | 0.33% | 0.44% | 0.65% | 0.22% | |
| JPY | -0.35% | -0.80% | -0.69% | -0.31% | -0.17% | 0.08% | -0.45% | |
| CAD | -0.06% | -0.48% | -0.33% | 0.31% | 0.20% | 0.32% | -0.11% | |
| AUD | -0.21% | -0.59% | -0.44% | 0.17% | -0.20% | 0.19% | -0.23% | |
| NZD | -0.37% | -0.79% | -0.65% | -0.08% | -0.32% | -0.19% | -0.42% | |
| CHF | 0.00% | -0.37% | -0.22% | 0.45% | 0.11% | 0.23% | 0.42% |
The heat map shows percentage changes of major currencies against each other. The base currency is picked from the left column, while the quote currency is picked from the top row. For example, if you pick the Japanese Yen from the left column and move along the horizontal line to the US Dollar, the percentage change displayed in the box will represent JPY (base)/USD (quote).