Physical Address
304 North Cardinal St.
Dorchester Center, MA 02124
Physical Address
304 North Cardinal St.
Dorchester Center, MA 02124

Gold price (XAU/USD) maintains its offered tone heading into the European session on Monday and is currently placed around the $2,750 area, down 0.65% for the day. The ongoing retracement slide from the highest level since late October, around the $2,786 region touched on Friday, is sponsored by a goodish US Dollar (USD) recovery from over a one-month low, which is seen undermining the commodity. That said, the fundamental backdrop warrants some caution before placing aggressive bearish bets and positioning for deeper losses.
US President Donald Trump’s decision to impose tariffs on all imports from Colombia revives trade war fears and tempers investors’ appetite for riskier assets. The global flight to safety, along with the possibility that the Federal Reserve (Fed) would cut interest rates twice by the end of this year, triggers a fresh leg down in the US Treasury bond yields. This, in turn, could keep a lid on any further USD appreciating move and help limit any meaningful corrective pullback in the Gold price, from the vicinity of the all-time peak.
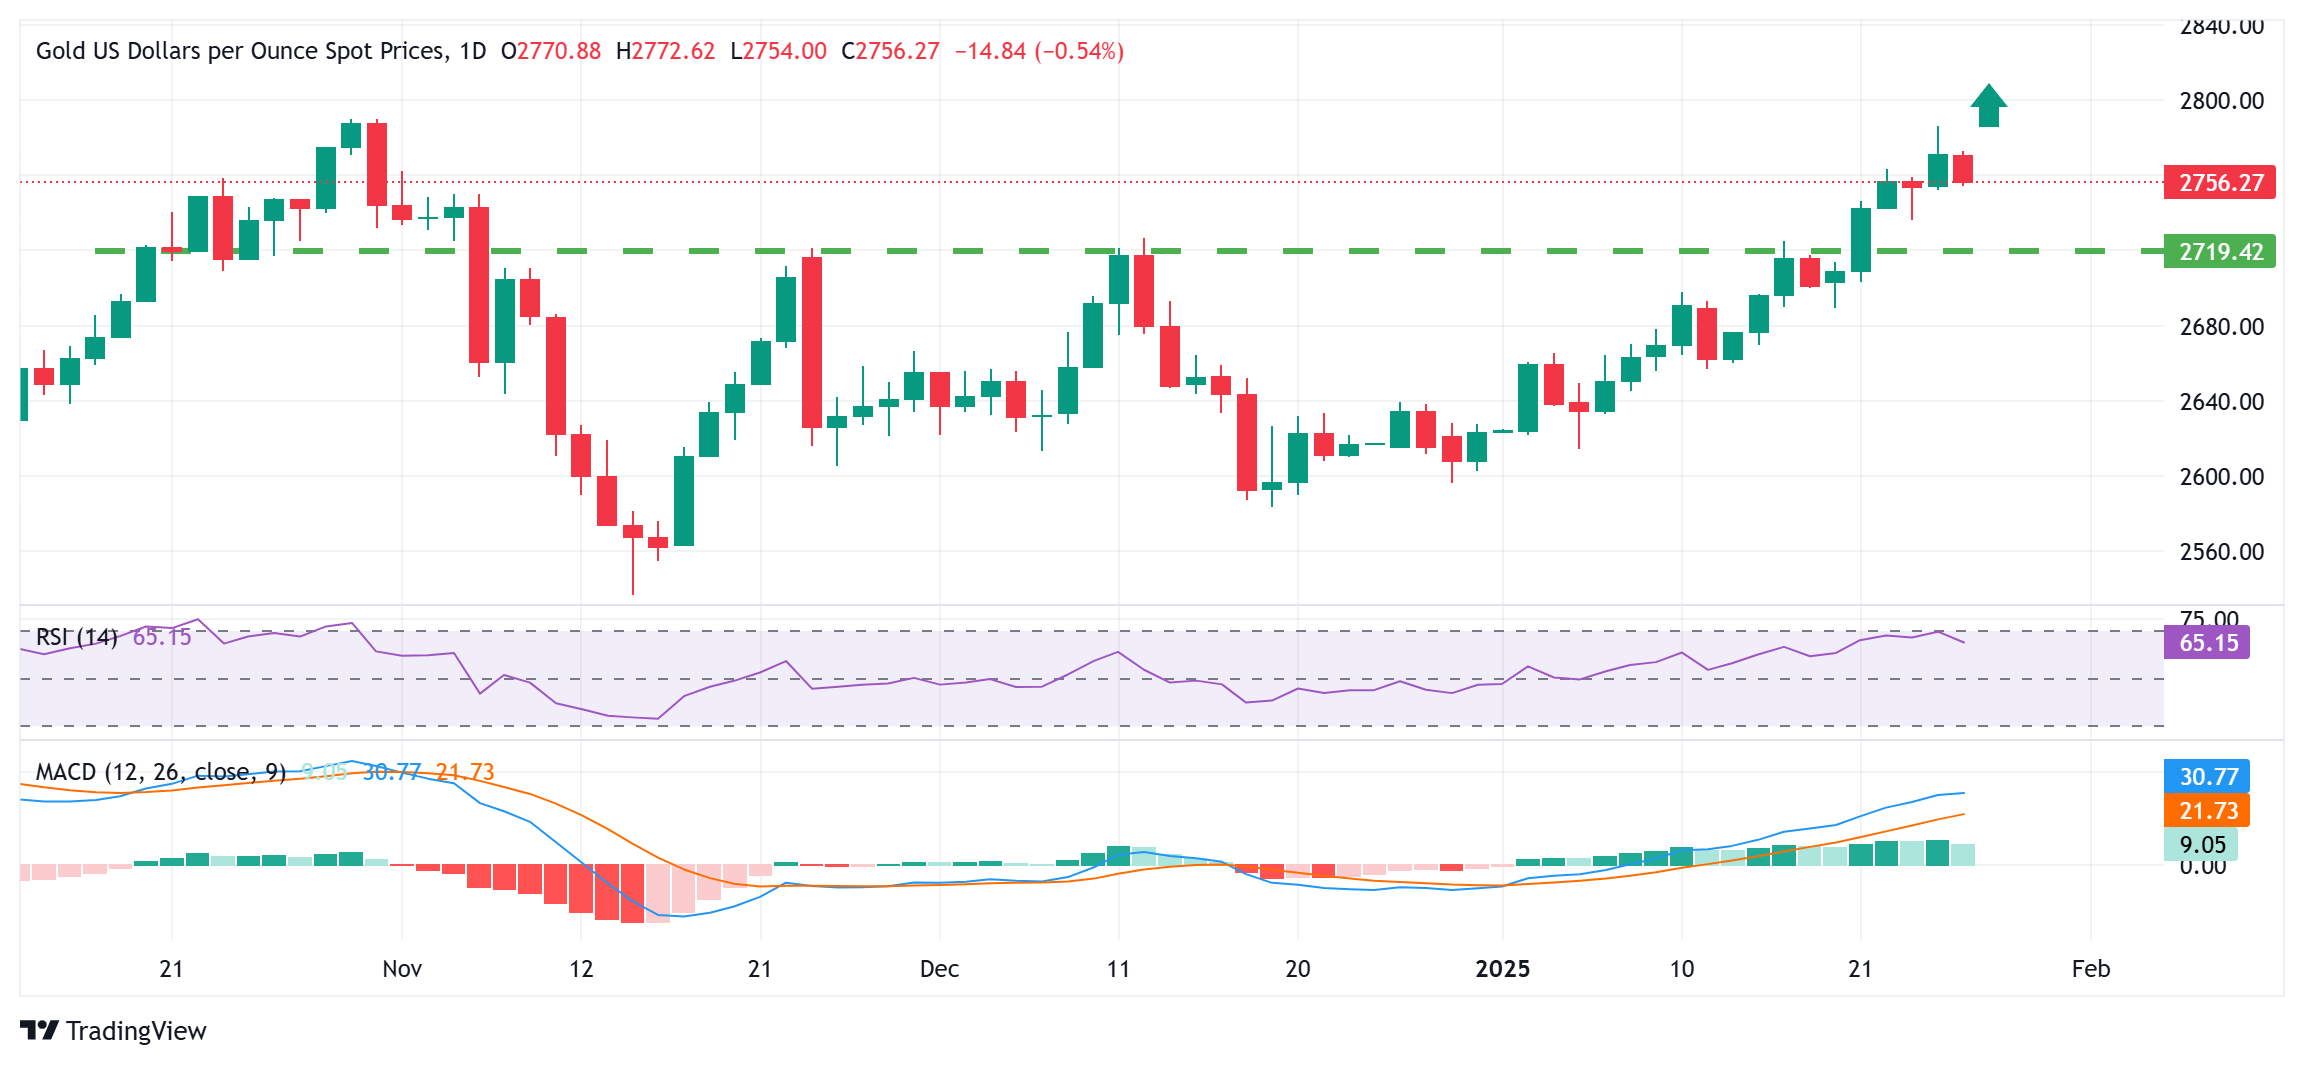
Any subsequent slide below the $2,750-2,748 zone is likely to find support near the $2,736 area ahead of the $2,725-2,720 strong resistance breakpoint. The latter should act as a key pivotal point, which if broken might prompt some technical selling and drag the Gold price below the $2,700 mark, towards the next relevant support near the $2,665-2,662 area.
On the flip side, momentum beyond the $2,772-2,773 immediate hurdle should pave the way for a move back towards the all-time peak, around the $2,790 region touched in October. Some follow-through buying, leading to a strength beyond the $2,800 mark, will be seen as a fresh trigger for bullish traders and pave the way for an extension of the positive move.
The table below shows the percentage change of US Dollar (USD) against listed major currencies today. US Dollar was the strongest against the Australian Dollar.
| USD | EUR | GBP | JPY | CAD | AUD | NZD | CHF | |
|---|---|---|---|---|---|---|---|---|
| USD | 0.38% | 0.31% | 0.11% | 0.20% | 0.53% | 0.45% | 0.17% | |
| EUR | -0.38% | 0.00% | -0.13% | -0.03% | 0.16% | 0.20% | -0.10% | |
| GBP | -0.31% | -0.01% | -0.45% | -0.04% | 0.16% | 0.21% | -0.11% | |
| JPY | -0.11% | 0.13% | 0.45% | 0.13% | 0.60% | 0.58% | 0.20% | |
| CAD | -0.20% | 0.03% | 0.04% | -0.13% | 0.13% | 0.25% | -0.07% | |
| AUD | -0.53% | -0.16% | -0.16% | -0.60% | -0.13% | 0.07% | -0.22% | |
| NZD | -0.45% | -0.20% | -0.21% | -0.58% | -0.25% | -0.07% | -0.53% | |
| CHF | -0.17% | 0.10% | 0.11% | -0.20% | 0.07% | 0.22% | 0.53% |
The heat map shows percentage changes of major currencies against each other. The base currency is picked from the left column, while the quote currency is picked from the top row. For example, if you pick the US Dollar from the left column and move along the horizontal line to the Japanese Yen, the percentage change displayed in the box will represent USD (base)/JPY (quote).