Physical Address
304 North Cardinal St.
Dorchester Center, MA 02124
Physical Address
304 North Cardinal St.
Dorchester Center, MA 02124

Gold price (XAU/USD) trims a part of modest intraday losses, though remains depressed below the $3,400 mark and over a two-week high touched earlier this Friday. Against the backdrop of the upbeat market mood, a modest US Dollar (USD) uptick prompts some profit-taking around the commodity following the recent move higher over the past week or so. However, a combination of factors helps limit the downside for the precious metal.
US President Donald Trump’s fresh tariff threats this week keep investors on edge and continue to act as a tailwind for the safe-haven Gold price. Furthermore, the growing acceptance that the Federal Reserve (Fed) will resume its rate-cutting cycle in September keeps a lid on any meaningful USD gains and further offers some support to the non-yielding yellow metal. This warrants caution before placing bearish bets around the XAU/USD pair.
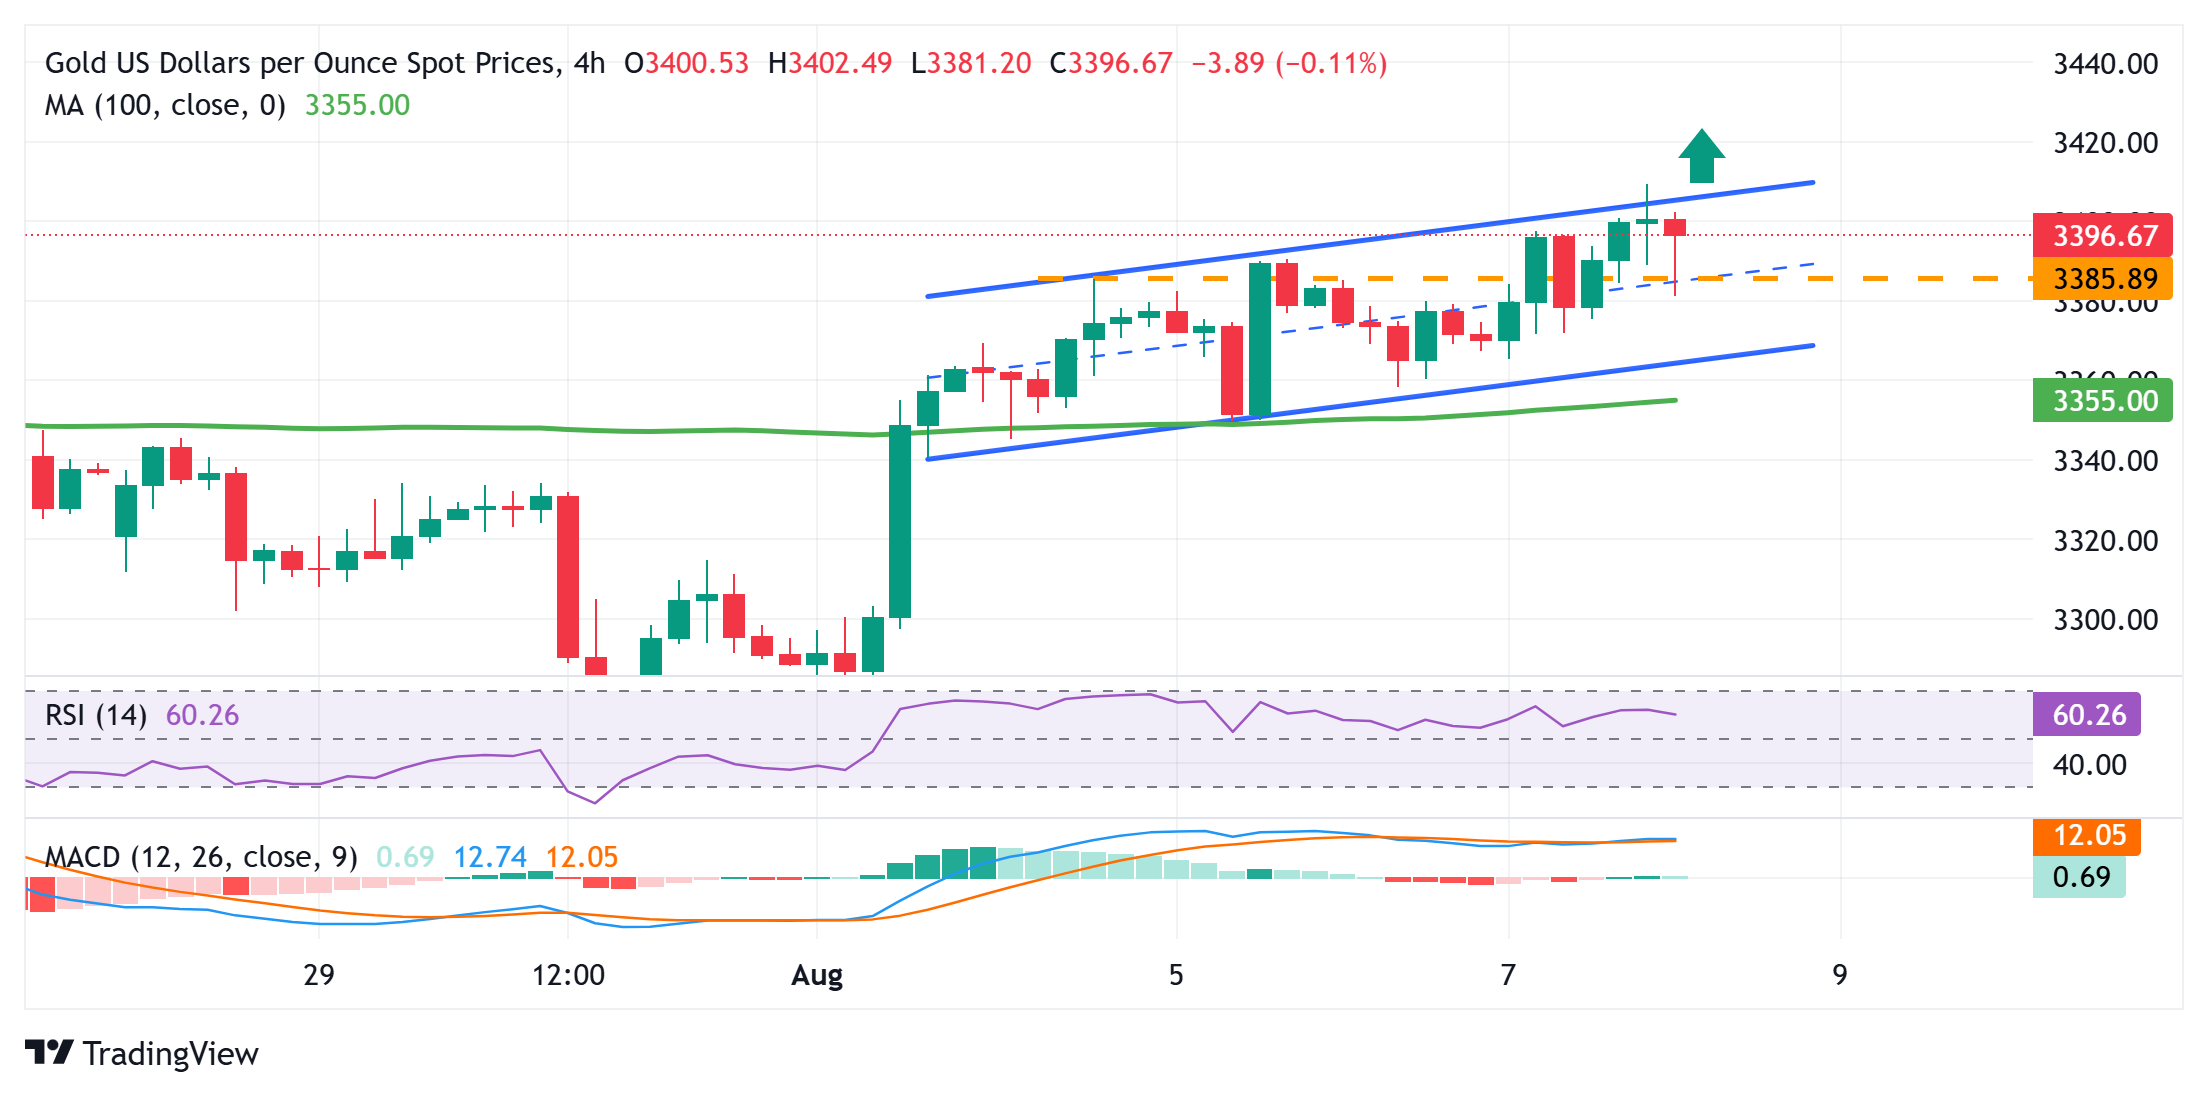
From a technical perspective, the overnight sustained strength beyond the $3,383-3,385 supply zone and positive oscillators on the daily chart suggest that the path of least resistance for the commodity is to the upside. However, the Asian session uptick falters near a resistance marked by the top boundary of the weekly uptrend. Hence, it will be prudent to wait for some follow-through buying beyond the $3,309-3,310 region before positioning for further gains. The momentum might then lift the Gold price to the next relevant hurdle near the $3,422-3,423 area en route to the $3,434-3,435 region. A sustained strength beyond the latter should pave the way for a move towards challenging the all-time peak, around the $3,500 psychological mark touched in April.
On the flip side, weakness below the trading range resistance breakpoint, around the $3,385-3,383 region, could be seen as a buying opportunity and remain cushioned near the $3,353-3,350 area. The latter represents the 200-period Simple Moving Average (SMA) on the 4-hour chart, which should act as a key pivotal point. A convincing break below might shift the bias in favor of bearish traders and drag the Gold price to the $3,315 intermediate support en route to the $3,300 round figure and the $3,268 region, or a one-month low touched last week.
The table below shows the percentage change of US Dollar (USD) against listed major currencies today. US Dollar was the strongest against the Euro.
| USD | EUR | GBP | JPY | CAD | AUD | NZD | CHF | |
|---|---|---|---|---|---|---|---|---|
| USD | 0.23% | 0.12% | 0.19% | 0.01% | 0.06% | -0.08% | 0.17% | |
| EUR | -0.23% | -0.08% | 0.00% | -0.19% | -0.13% | -0.21% | -0.05% | |
| GBP | -0.12% | 0.08% | 0.08% | -0.11% | -0.15% | 0.00% | -0.04% | |
| JPY | -0.19% | 0.00% | -0.08% | -0.17% | -0.19% | -0.24% | 0.00% | |
| CAD | -0.01% | 0.19% | 0.11% | 0.17% | 0.08% | 0.09% | 0.12% | |
| AUD | -0.06% | 0.13% | 0.15% | 0.19% | -0.08% | 0.02% | 0.04% | |
| NZD | 0.08% | 0.21% | -0.00% | 0.24% | -0.09% | -0.02% | 0.09% | |
| CHF | -0.17% | 0.05% | 0.04% | 0.00% | -0.12% | -0.04% | -0.09% |
The heat map shows percentage changes of major currencies against each other. The base currency is picked from the left column, while the quote currency is picked from the top row. For example, if you pick the US Dollar from the left column and move along the horizontal line to the Japanese Yen, the percentage change displayed in the box will represent USD (base)/JPY (quote).