Physical Address
304 North Cardinal St.
Dorchester Center, MA 02124
Physical Address
304 North Cardinal St.
Dorchester Center, MA 02124

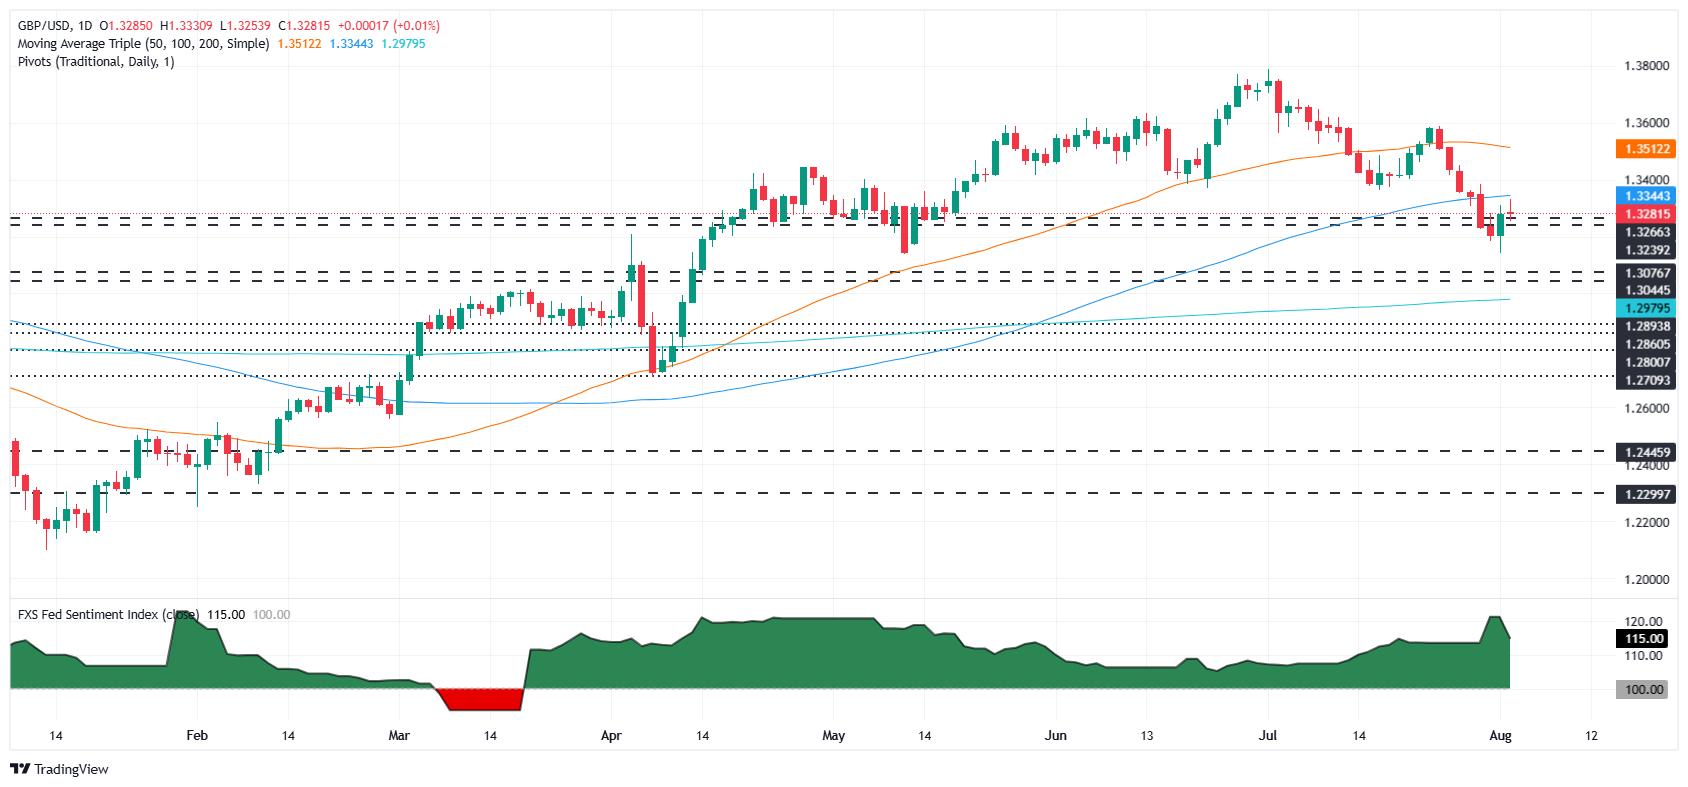
The GBP/USD rallies for the second straight day, up by 0.12% following a dismal jobs report in the United States (US). The data prompted investors to price in a rate cut by the Federal Reserve at the upcoming September meeting. The pair trades at 1.3289, after bouncing off daily lows of 1.3253.
Last week, the 258K revision to Nonfarm Payroll figures for May and June, along with July’s 73K print, below forecasts of 110K, weighed on the Dollar amidst fears that the labor market begins to show some cracks. The NFP report triggered the firing of the US Bureau of Labor Statistics (BLS) Commissioner Erika McEntarfer by US President Donald Trump, who said that the BLS faked jobs numbers.
Consequently, the GBP/USD recovered some ground, though it ended July with losses of over 3.8%. In the meantime, traders brace for the Bank of England (BoE) monetary policy decision this week, with markets pricing a 90% chance of a 25 basis points (bps) cut on August 7. For the rest of 2025, the markets seem convinced that the BoE will slash 50 bps of the Bank rate.
On the data front, US Factory Orders plummeted in June, due to commercial orders for aircraft plunging. The numbers came at -4.8% as expected, down from May’s 8.2% positive print.
The GBP/USD halted its downtrend, yet it remains poised to consolidate within the 1.3200 – 1.3300 range for the first day of the week. After hitting a daily high of 1.3330, the pair dipped close to 50 pips, forming an ‘inverted hammer’ or shooting star. This suggests traders are reluctant to push prices higher, and a daily close below 1.3300 could sponsor a test of lower prices.
The first support is 1.3250, followed by 1.3200 and July’s bottom of 1.3141. Conversely, a daily close above 1.3300 can sponsor a test of the 100-day SMA at 1.3340, ahead of testing the June 23 support turned resistance at 1.3369.
The table below shows the percentage change of British Pound (GBP) against listed major currencies this month. British Pound was the strongest against the US Dollar.
| USD | EUR | GBP | JPY | CAD | AUD | NZD | CHF | |
|---|---|---|---|---|---|---|---|---|
| USD | -1.21% | -0.58% | -2.37% | -0.51% | -0.51% | -0.04% | -0.45% | |
| EUR | 1.21% | 0.74% | -1.16% | 0.77% | 0.84% | 1.03% | 0.83% | |
| GBP | 0.58% | -0.74% | -1.86% | 0.03% | 0.10% | 0.50% | 0.11% | |
| JPY | 2.37% | 1.16% | 1.86% | 1.88% | 1.90% | 2.26% | 1.97% | |
| CAD | 0.51% | -0.77% | -0.03% | -1.88% | -0.02% | 0.47% | 0.08% | |
| AUD | 0.51% | -0.84% | -0.10% | -1.90% | 0.02% | 0.40% | 0.11% | |
| NZD | 0.04% | -1.03% | -0.50% | -2.26% | -0.47% | -0.40% | -0.29% | |
| CHF | 0.45% | -0.83% | -0.11% | -1.97% | -0.08% | -0.11% | 0.29% |
The heat map shows percentage changes of major currencies against each other. The base currency is picked from the left column, while the quote currency is picked from the top row. For example, if you pick the British Pound from the left column and move along the horizontal line to the US Dollar, the percentage change displayed in the box will represent GBP (base)/USD (quote).