Physical Address
304 North Cardinal St.
Dorchester Center, MA 02124
Physical Address
304 North Cardinal St.
Dorchester Center, MA 02124

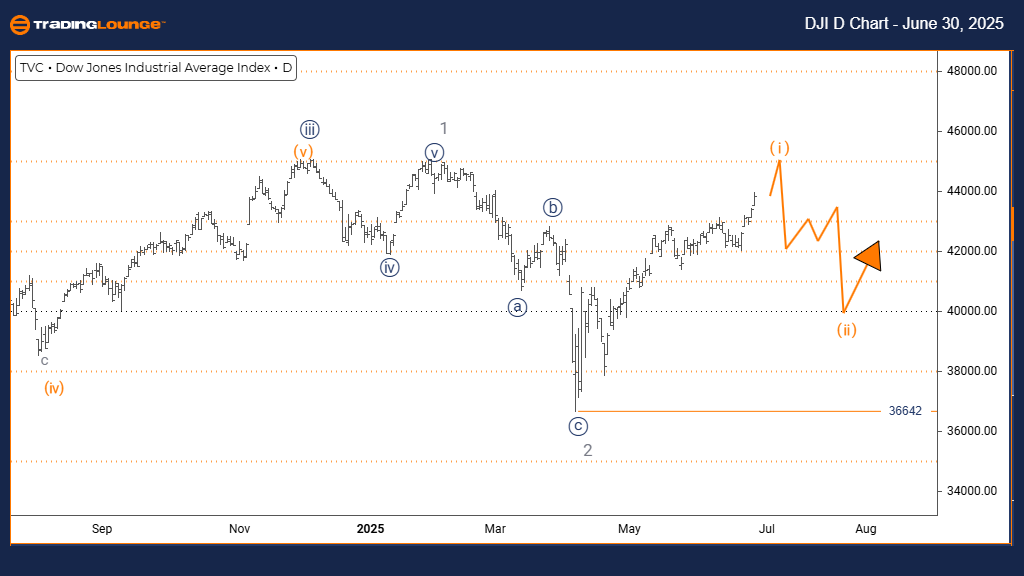
Function: Bullish Trend.
Mode: Impulsive.
Structure: Orange Wave 1.
Position: Navy Blue Wave 1.
Direction next lower degrees: Orange Wave 2.
Details: Gray Wave 2 appears complete. Currently, Orange Wave 1 of Navy Blue Wave 1 is underway.
Wave cancellation invalidation level: 36,642
The daily chart analysis of the DOW JONES – DJI using Elliott Wave theory suggests a bullish trend. Price action remains in impulsive mode, indicating strong upward momentum. The current wave formation is labeled as Orange Wave 1, which forms a segment of the broader Navy Blue Wave 1. This wave structure implies the index may be at the early stage of a significant upward movement within a larger bullish framework.
Gray Wave 2 looks to have concluded its corrective cycle, initiating Orange Wave 1 of Navy Blue Wave 1. This change indicates the potential start of a new impulsive rally. Following the expected end of Orange Wave 1, the next move is projected to be Orange Wave 2, typically a corrective phase, before resuming the upward trend.
The key invalidation level for this wave structure is set at 36,642. A drop below this point would negate the current Elliott Wave outlook, necessitating a new wave interpretation. Unless this level is breached, the current bullish outlook remains intact, with the chart favoring continued upward momentum.
Given the setup, DOW JONES – DJI appears positioned for a possible extended advance as part of Navy Blue Wave 1, with Orange Wave 1 now progressing. The completed Gray Wave 2 confirms the bullish phase, and the impulsive trend highlights strong buying interest, suggesting potential for further gains.
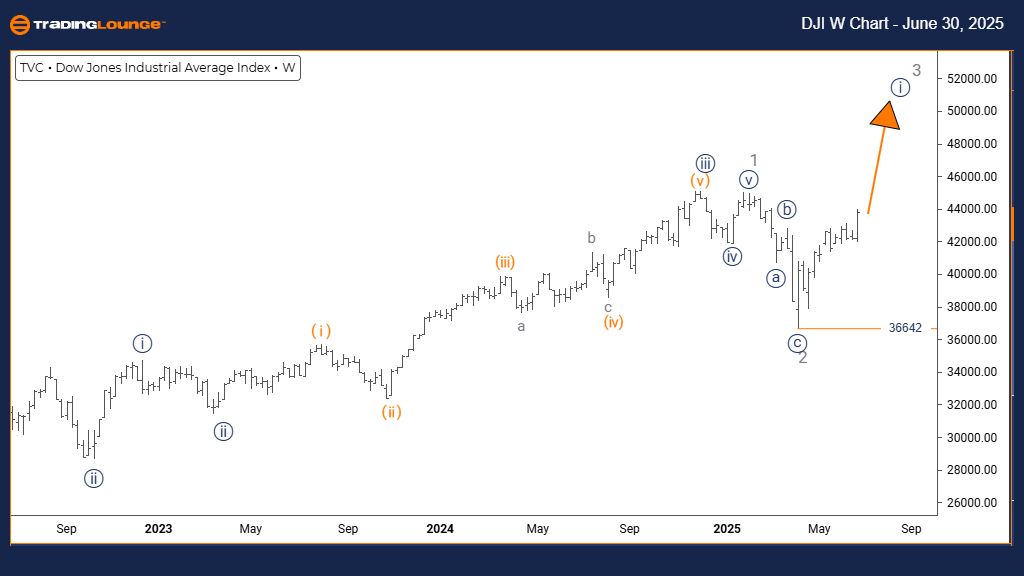
Function: Bullish Trend.
Mode: Impulsive.
Structure: Navy Blue Wave 1.
Position: Gray Wave 3.
Direction next lower degrees: Navy Blue Wave 2.
Details: Gray Wave 2 appears complete. Currently, Navy Blue Wave 1 of Gray Wave 3 is underway.
Wave cancellation invalidation level: 36,642
The weekly chart analysis of the DOW JONES – DJI using Elliott Wave methodology supports a bullish trend. The current market action remains in impulsive mode, indicating strong upward direction. The wave structure is labeled as Navy Blue Wave 1, which is a component of a broader Gray Wave 3. This position suggests that the market may be in the early phase of a substantial uptrend.
Gray Wave 2 seems to have concluded its correction, triggering the development of Navy Blue Wave 1 within Gray Wave 3. This wave structure marks the initial part of a third wave sequence, which often carries the strongest momentum in Elliott Wave theory. After the expected completion of Navy Blue Wave 1, a corrective phase—Navy Blue Wave 2—is projected to follow.
The critical level to observe is the wave cancellation point at 36,642. If prices fall below this threshold, the current wave interpretation becomes invalid, necessitating a revised analysis. As long as this level holds, the outlook remains bullish with potential for continued upward movement.
Technically, DOW JONES – DJI appears to be at the beginning of a larger uptrend, with Navy Blue Wave 1 actively progressing within Gray Wave 3. The impulsive behavior of the trend implies strong institutional buying interest and suggests that gains may continue as this structure evolves.