Physical Address
304 North Cardinal St.
Dorchester Center, MA 02124
Physical Address
304 North Cardinal St.
Dorchester Center, MA 02124

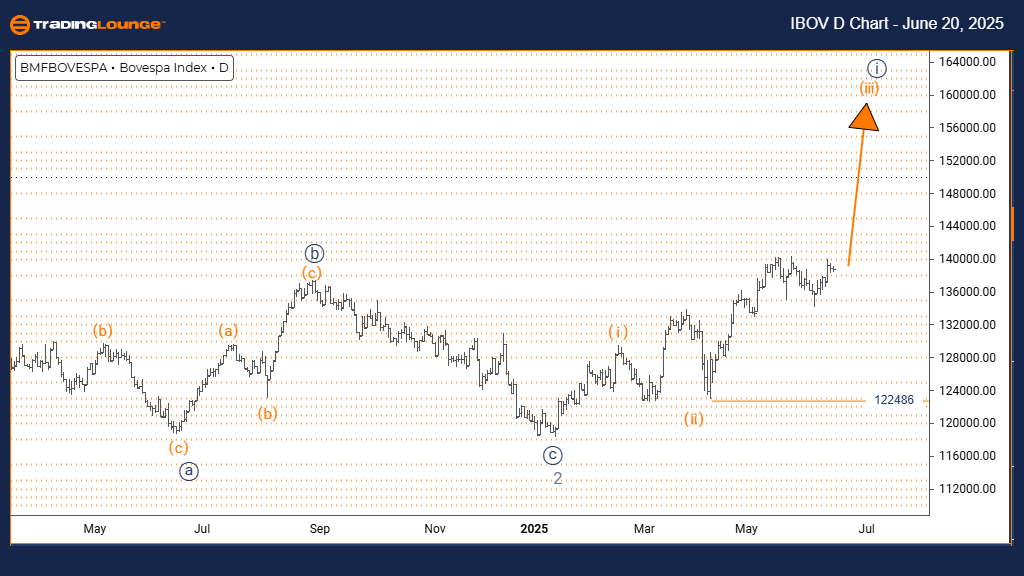
Function: Bullish Trend.
Mode: Impulsive.
Structure: Orange wave 3.
Position: Navy blue wave 1.
Direction next lower degrees: Orange wave 4.
Details: Orange wave 2 appears complete; orange wave 3 is now unfolding.
Wave cancel invalidation level: 122486
The Bovespa Index daily chart indicates a bullish trend. The price action is moving in impulsive mode, suggesting strong upward momentum. The current structure reflects orange wave 3, which fits into the broader navy blue wave 1 sequence. This implies that the index is in an early advancing stage within a longer bullish cycle.
Orange wave 2 has likely completed its correction phase, leading into orange wave 3. Historically, wave 3 in Elliott Wave theory is often the strongest and can produce large price advances. The next expected move will be a pullback in orange wave 4 once wave 3 completes.
A key technical level to monitor is 122486. If prices fall below this, the wave structure would be invalid, requiring a reevaluation of the bullish scenario. Until then, the current pattern supports ongoing upward movement.
The technical analysis suggests the Bovespa Index is well-positioned for sustained upward movement, driven by the impulsive characteristics of orange wave 3.
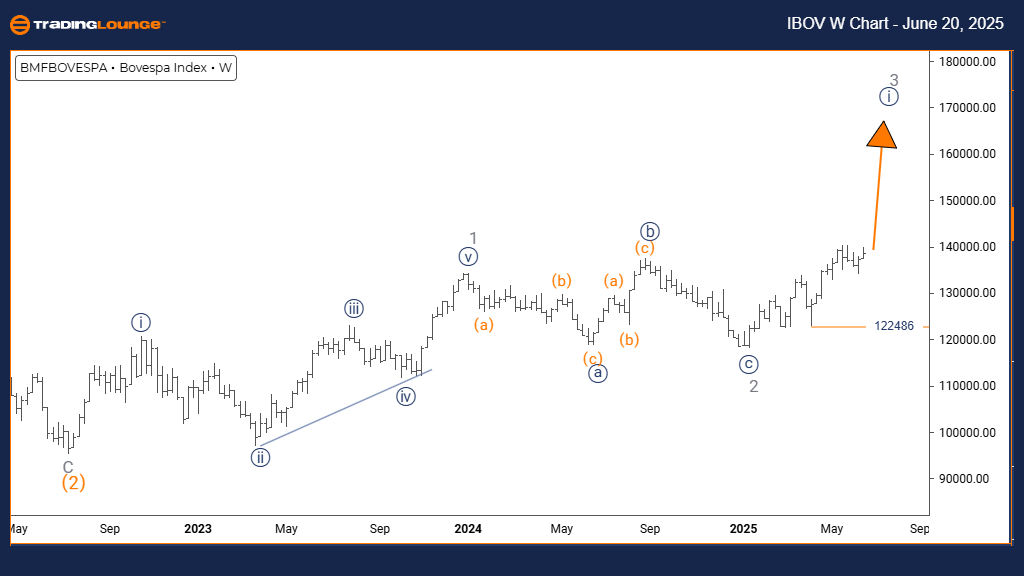
Function: Bullish Trend.
Mode: Impulsive.
Structure: Navy blue wave 1.
Position: Gray wave 3.
Direction next lower degrees: Navy blue wave 2.
Details: Gray wave 2 appears complete; navy blue wave 1 is now active.
Wave cancel invalidation level: 122486.
The Bovespa Index weekly chart confirms a strong bullish trend. The index remains in impulsive mode with upward price momentum. The current wave structure is navy blue wave 1, part of the larger gray wave 3 formation. This signals an early-stage movement in a more extensive bullish cycle.
With gray wave 2 likely complete, the transition into navy blue wave 1 has begun. This typically marks a significant growth phase, with wave 2 expected as a corrective pullback once wave 1 finalizes.
A critical invalidation level is 122486. Dropping below this level would invalidate the wave structure and call for a new analysis. As long as this threshold holds, the bullish outlook continues.
The setup implies robust institutional interest, with navy blue wave 1 now active and potential for continued growth in the upcoming weeks as it develops within gray wave 3.