Physical Address
304 North Cardinal St.
Dorchester Center, MA 02124
Physical Address
304 North Cardinal St.
Dorchester Center, MA 02124

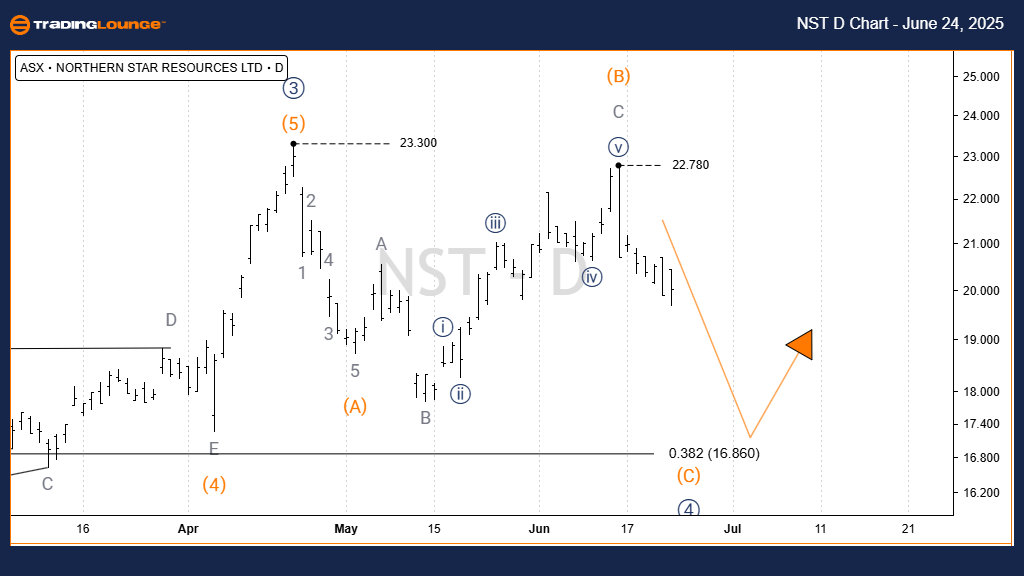
Today’s Elliott Wave update focuses on NORTHERN STAR RESOURCES LTD – NST listed on the Australian Stock Exchange (ASX).
Our technical analysis suggests that ASX:NST is likely entering a short-term bearish trend, potentially heading towards 16.86. Based on our assessment, a bullish reversal is not expected at this point.
Currently, Wave 4)) – Navy is unfolding downward, appearing to develop as an ABC – Orange Zigzag.
Wave A)B) – Orange seems completed, and since the high at 22.78, Wave C) – Orange has likely started to move lower.
The projected target is around 16.86, showing no signals of a bullish setup.
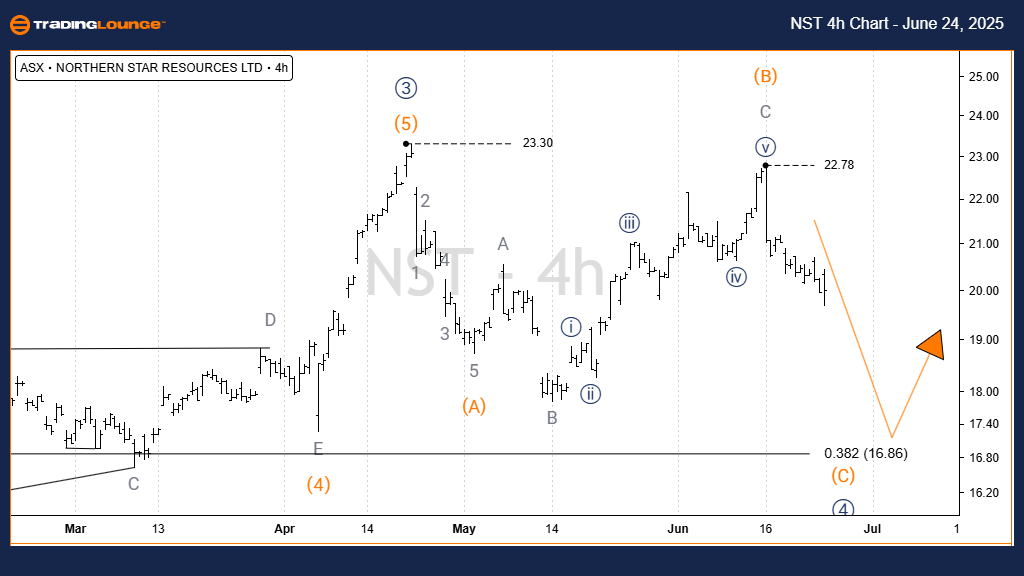
Details:
In the shorter 4-hour timeframe, no bullish evidence is observed.
After the high at 22.78, Wave C) – Orange appears to continue declining toward 16.86.
This analysis delivers a contextual understanding of short-term trends for ASX: NST.
We identify key levels that act as validation or invalidation signals, aiding the accuracy of our wave counts.
Our goal is to offer a clear, professional insight into current market trends, helping traders make informed decisions.