Physical Address
304 North Cardinal St.
Dorchester Center, MA 02124
Physical Address
304 North Cardinal St.
Dorchester Center, MA 02124

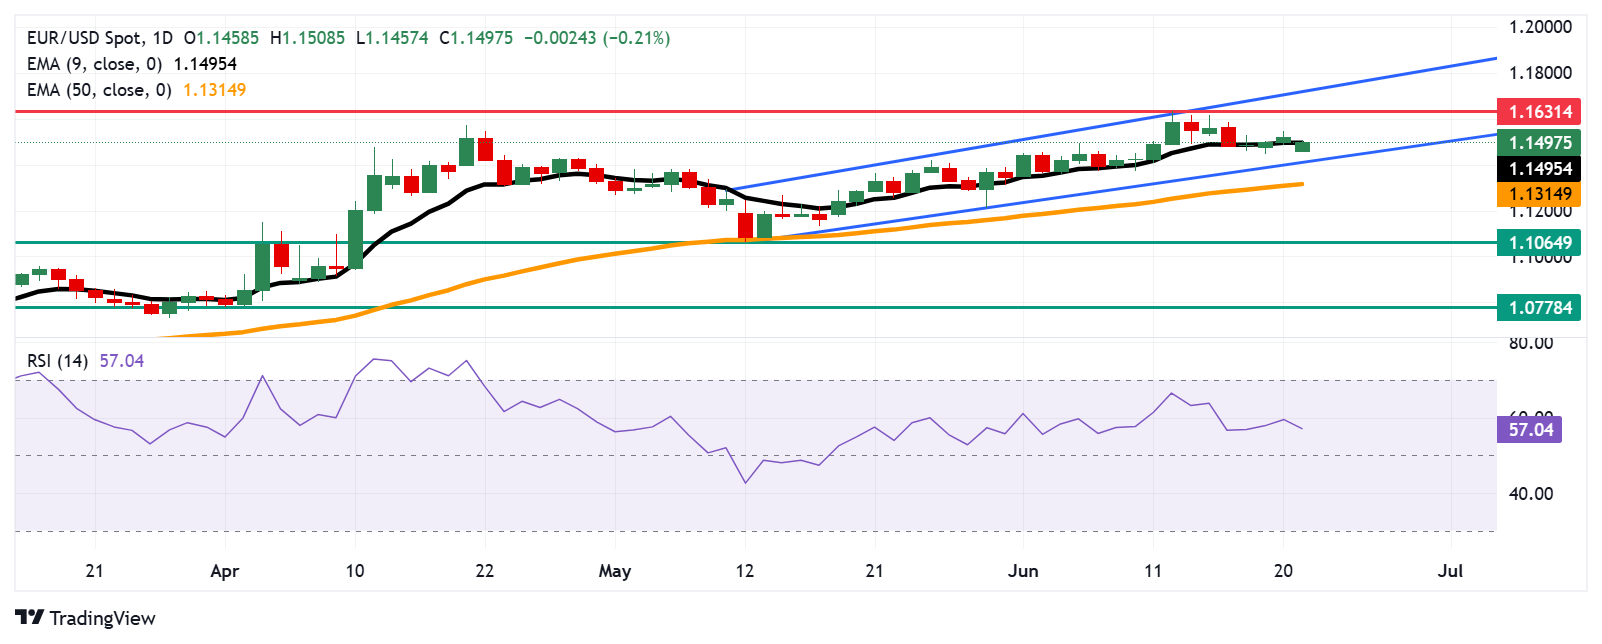
EUR/USD extends its winning streak for the fourth successive session, trading around 1.1490 during the Asian hours on Monday. On the daily chart, technical analysis indicates a strengthening of a bullish bias, as the pair continues to trade within an ascending channel pattern.
The 14-day Relative Strength Index (RSI) remains above the 50 level, strengthening the bullish outlook. However, the EUR/USD pair is positioned below the nine-day Exponential Moving Average (EMA), indicating that short-term price momentum is weakening.
On the upside, the EUR/USD pair is testing the immediate barrier at the nine-day EMA of 1.1494. A break above this level would improve the short-term price momentum and prompt the pair to challenge the 1.1631, the highest since October 2021, which was marked on June 12, followed by the upper boundary of the ascending channel around 1.1730.
The EUR/USD pair may find the initial support at the ascending channel’s lower boundary around 1.1420. A break below the channel may cause the emergence of the bearish bias and put downward pressure on the pair to test the 50-day EMA at 1.1314.
Further decline would weaken the medium-term price momentum and lead the pair to test the two-month low of 1.1064, followed by the three-month low of 1.0778, last seen on April 1.
The table below shows the percentage change of Euro (EUR) against listed major currencies today. Euro was the strongest against the New Zealand Dollar.
| USD | EUR | GBP | JPY | CAD | AUD | NZD | CHF | |
|---|---|---|---|---|---|---|---|---|
| USD | -0.38% | -0.12% | 0.24% | 0.03% | 0.35% | 0.45% | 0.03% | |
| EUR | 0.38% | 0.24% | 0.69% | 0.42% | 0.69% | 0.82% | 0.38% | |
| GBP | 0.12% | -0.24% | 0.47% | 0.18% | 0.46% | 0.59% | 0.14% | |
| JPY | -0.24% | -0.69% | -0.47% | -0.23% | 0.07% | 0.26% | -0.29% | |
| CAD | -0.03% | -0.42% | -0.18% | 0.23% | 0.36% | 0.41% | -0.04% | |
| AUD | -0.35% | -0.69% | -0.46% | -0.07% | -0.36% | 0.12% | -0.32% | |
| NZD | -0.45% | -0.82% | -0.59% | -0.26% | -0.41% | -0.12% | -0.45% | |
| CHF | -0.03% | -0.38% | -0.14% | 0.29% | 0.04% | 0.32% | 0.45% |
The heat map shows percentage changes of major currencies against each other. The base currency is picked from the left column, while the quote currency is picked from the top row. For example, if you pick the Euro from the left column and move along the horizontal line to the US Dollar, the percentage change displayed in the box will represent EUR (base)/USD (quote).