Physical Address
304 North Cardinal St.
Dorchester Center, MA 02124
Physical Address
304 North Cardinal St.
Dorchester Center, MA 02124

Gold price (XAU/USD) retains its bullish bias heading into the European session on Friday and touches a fresh multi-month top, around the $2,778 region in the last hour. US President Donald Trump’s comments, saying that he would rather not have to use tariffs on China, help ease trade-war fears and inflationary concerns. This, in turn, triggers a fresh leg down in the US Treasury bond yields amid Trump’s demand for lower rates, which drags the US Dollar (USD) to a one-month low and boosts demand for the non-yielding yellow metal.
Apart from this, worries about the potential economic fallout from Trump’s protectionist policies turn out to be another factor driving flows towards the safe-haven Gold price. That said, the underlying bullish tone around the equity markets might hold back traders from placing fresh bullish bets around the XAU/USD amid slightly overbought conditions on short-term charts. Nevertheless, the commodity remains on track to register gains for the fourth straight week as traders look to the flash global PMIs for short-term opportunities.
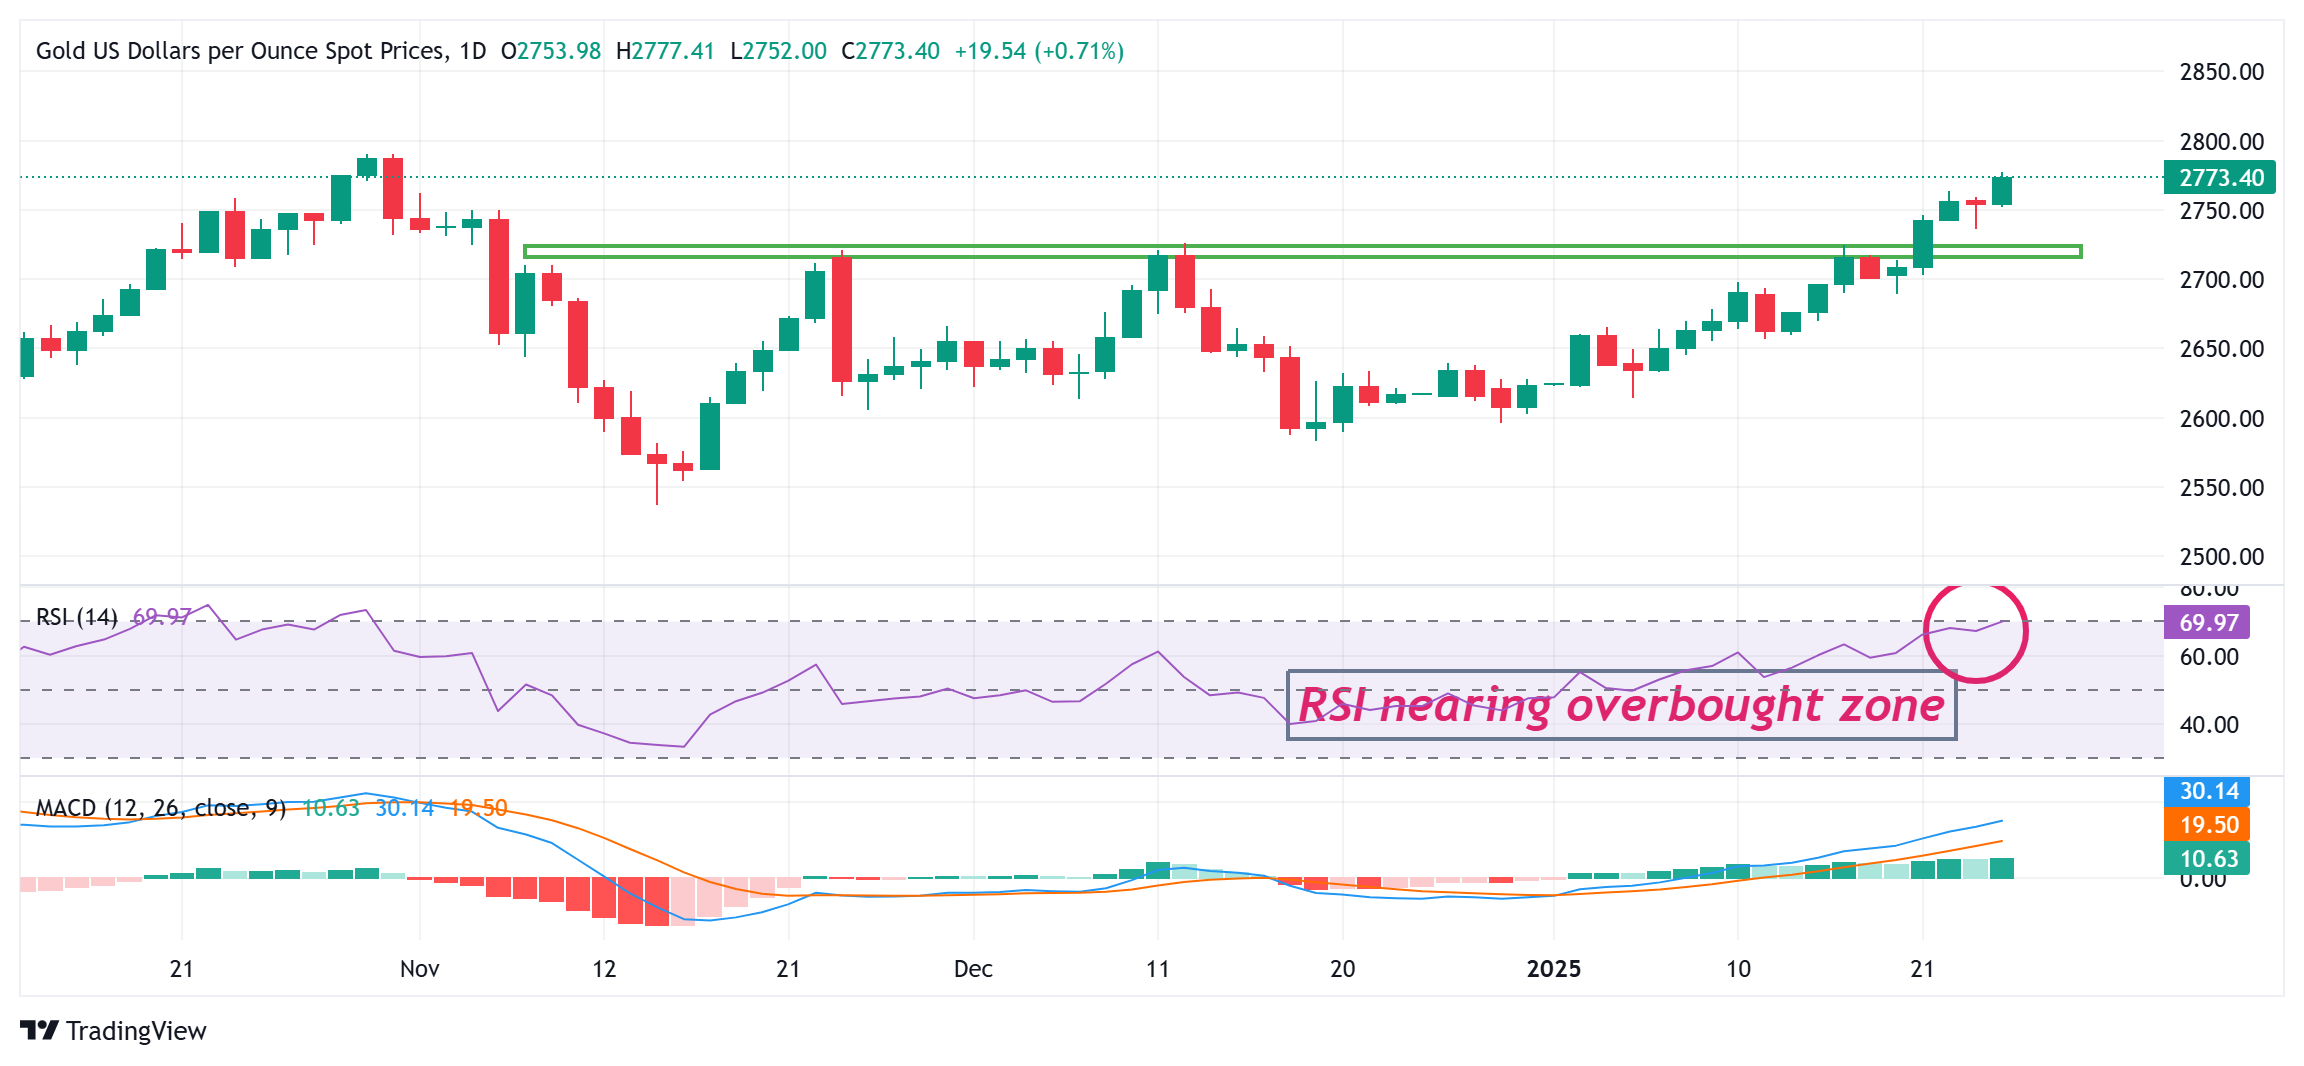
From a technical perspective, the emergence of some dip-buying on Thursday and the subsequent move up validate a bullish breakout through the $2,720-2,725 supply zone. That said, the Relative Strength Index (RSI) on the daily chart has moved on the verge of breaking into overbought territory, making it prudent to wait for some near-term consolidation or a modest pullback before positioning for further gains. Hence, some follow-through momentum is more likely to confront a stiff hurdle near the all-time peak, around the $2,790 region.
On the flip side, immediate support is pegged near the $2,760-2,758 area, below which the Gold price could slide to retest the overnight swing low, around the $2,736-2,735 region. Any further slide could be seen as a buying opportunity and remain limited near the $2,725-2,720 resistance-turned-support. The latter should act as a key pivotal point, which if broken decisively might shift the bias in favor of bearish trades and pave the way for deeper losses.
The table below shows the percentage change of US Dollar (USD) against listed major currencies today. US Dollar was the strongest against the Swiss Franc.
| USD | EUR | GBP | JPY | CAD | AUD | NZD | CHF | |
|---|---|---|---|---|---|---|---|---|
| USD | -0.49% | -0.50% | -0.74% | -0.35% | -0.68% | -0.76% | -0.34% | |
| EUR | 0.49% | -0.01% | -0.24% | 0.14% | -0.19% | -0.27% | 0.15% | |
| GBP | 0.50% | 0.01% | -0.23% | 0.15% | -0.17% | -0.25% | 0.16% | |
| JPY | 0.74% | 0.24% | 0.23% | 0.37% | 0.03% | -0.05% | 0.38% | |
| CAD | 0.35% | -0.14% | -0.15% | -0.37% | -0.33% | -0.41% | 0.01% | |
| AUD | 0.68% | 0.19% | 0.17% | -0.03% | 0.33% | -0.08% | 0.32% | |
| NZD | 0.76% | 0.27% | 0.25% | 0.05% | 0.41% | 0.08% | 0.41% | |
| CHF | 0.34% | -0.15% | -0.16% | -0.38% | -0.01% | -0.32% | -0.41% |
The heat map shows percentage changes of major currencies against each other. The base currency is picked from the left column, while the quote currency is picked from the top row. For example, if you pick the US Dollar from the left column and move along the horizontal line to the Japanese Yen, the percentage change displayed in the box will represent USD (base)/JPY (quote).